
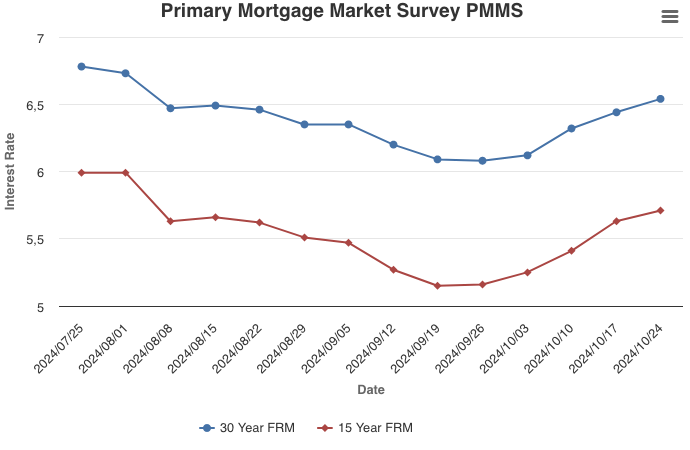
Mortgage Rates Increase Once Again
October 24, 2024
The continued strength in the economy drove mortgage rates higher once again this week. Over the last few years, there has been a tension between downbeat economic narrative and incoming economic data stronger than that narrative. This has led to higher-than-normal volatility in mortgage rates, despite a strengthening economy.
Information provided by Freddie Mac.
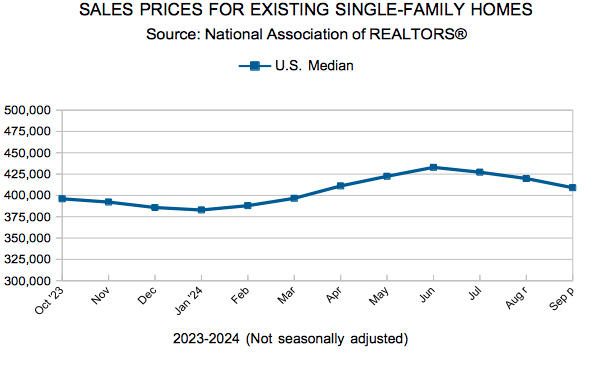
Existing Home Sales
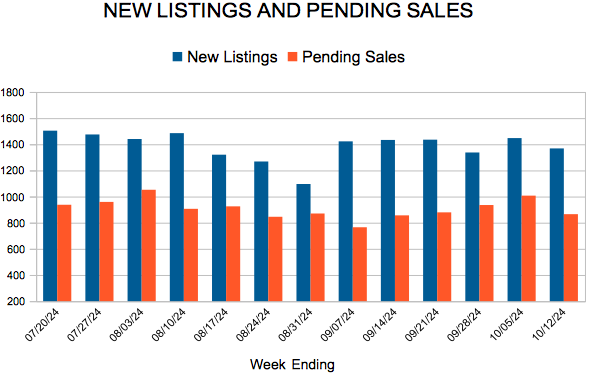
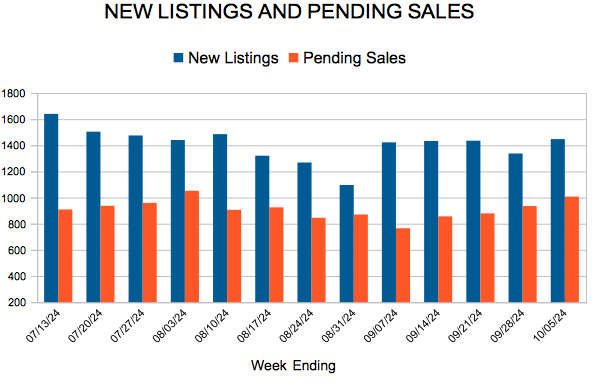
New Listings and Pending Sales
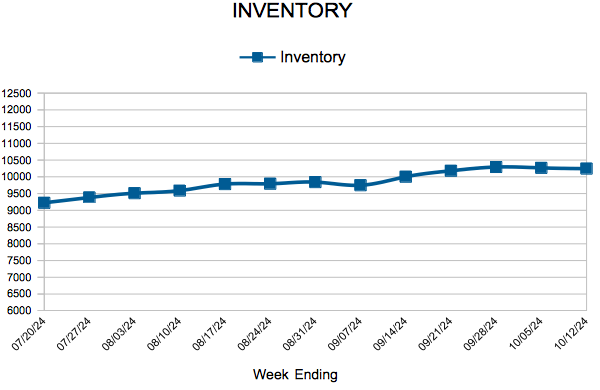
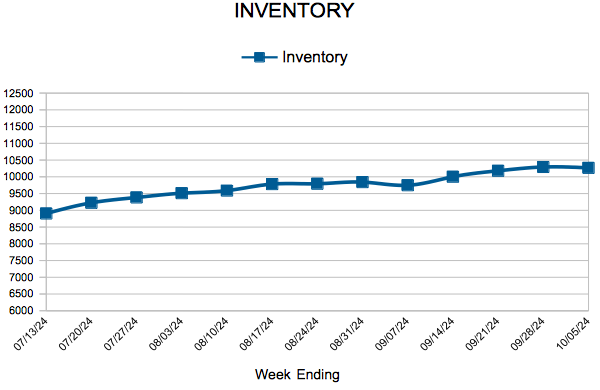
Inventory
Weekly Market Report
 For Week Ending October 12, 2024
According to the Mortgage Bankers Association, the median mortgage application payment was $2,057 in August, down from $2,140 in July, marking the fourth consecutive month affordability conditions improved. Mortgage rates are down significantly from their peak of 7.79% last October, which should help bring additional buyers to the market in the months ahead.
IN THE TWIN CITIES REGION, FOR THE WEEK ENDING OCTOBER 12:
- New Listings increased 12.5% to 1,368
- Pending Sales increased 7.3% to 865
- Inventory increased 10.8% to 10,244
FOR THE MONTH OF SEPTEMBER:
- Median Sales Price increased 2.4% to $379,950
- Days on Market increased 14.7% to 39
- Percent of Original List Price Received decreased 0.8% to 98.5%
- Months Supply of Homes For Sale increased 12.0% to 2.8
All comparisons are to 2023
Click here for the full Weekly Market Activity Report. From MAAR Market Data News.
Mortgage Rates Continue to Increase
October 17, 2024
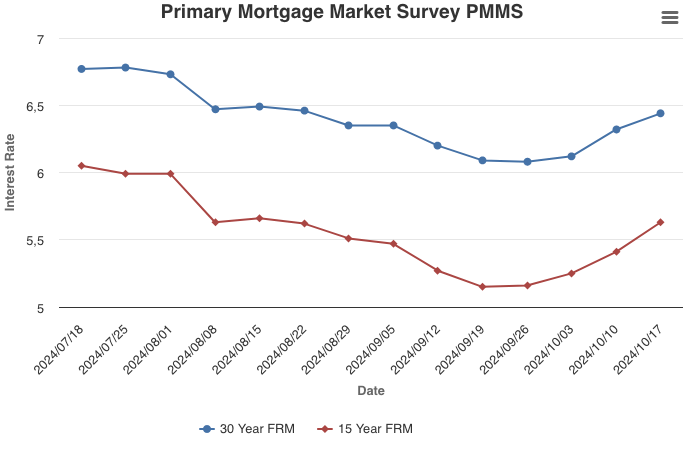
The 30-year fixed-rate mortgage increased for the third consecutive week, moving closer to 6.5%. In general, higher rates reflect the strength in the economy that is supportive of the housing market. But notably, as compared to a year ago, rates are more than one percentage point lower and potential homebuyers can stand to benefit, especially by shopping around for the best quote as rates can vary widely between mortgage lenders.
Information provided by Freddie Mac.
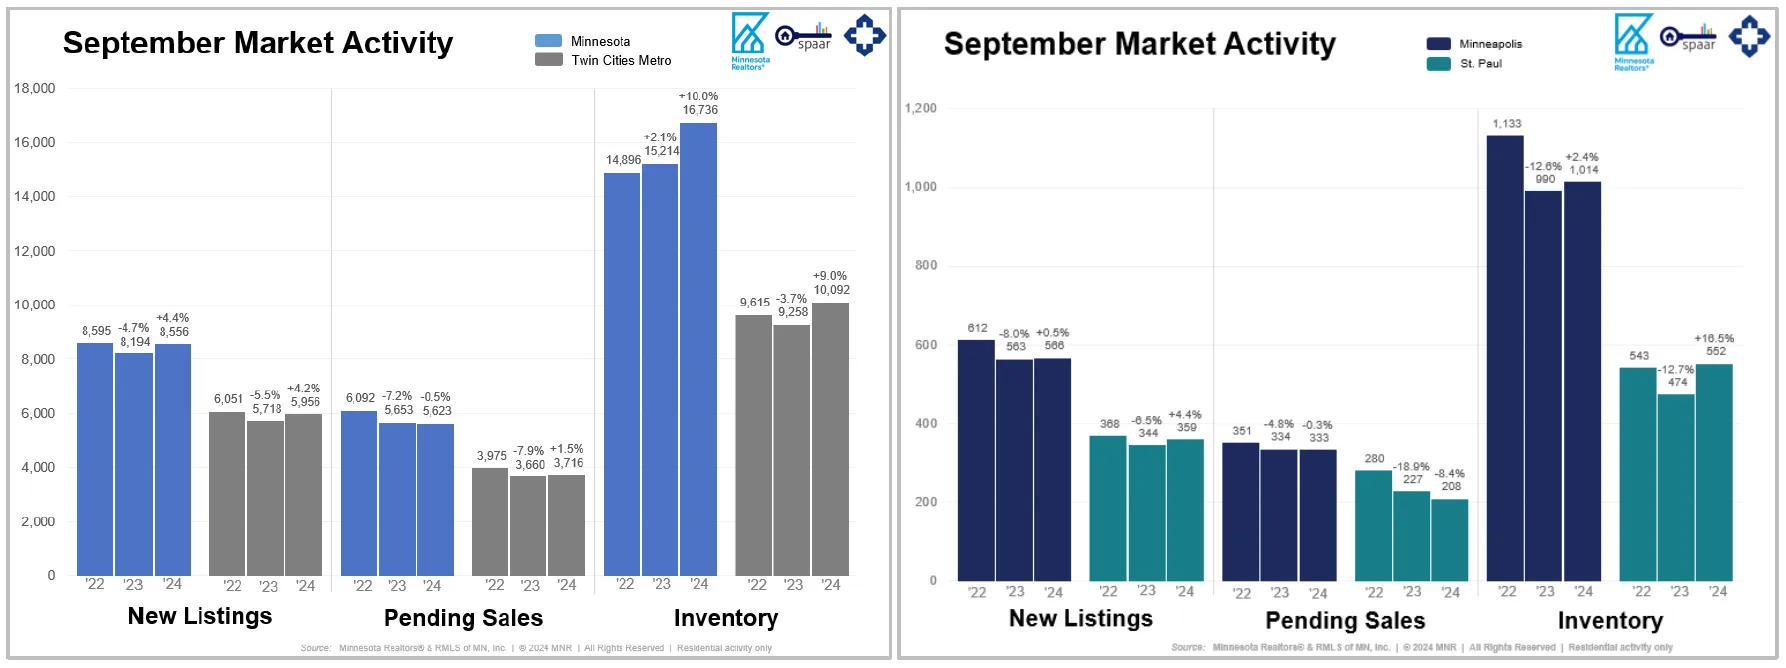
September Housing Market Update
Affordability inches up alongside inventory while sales stabilize
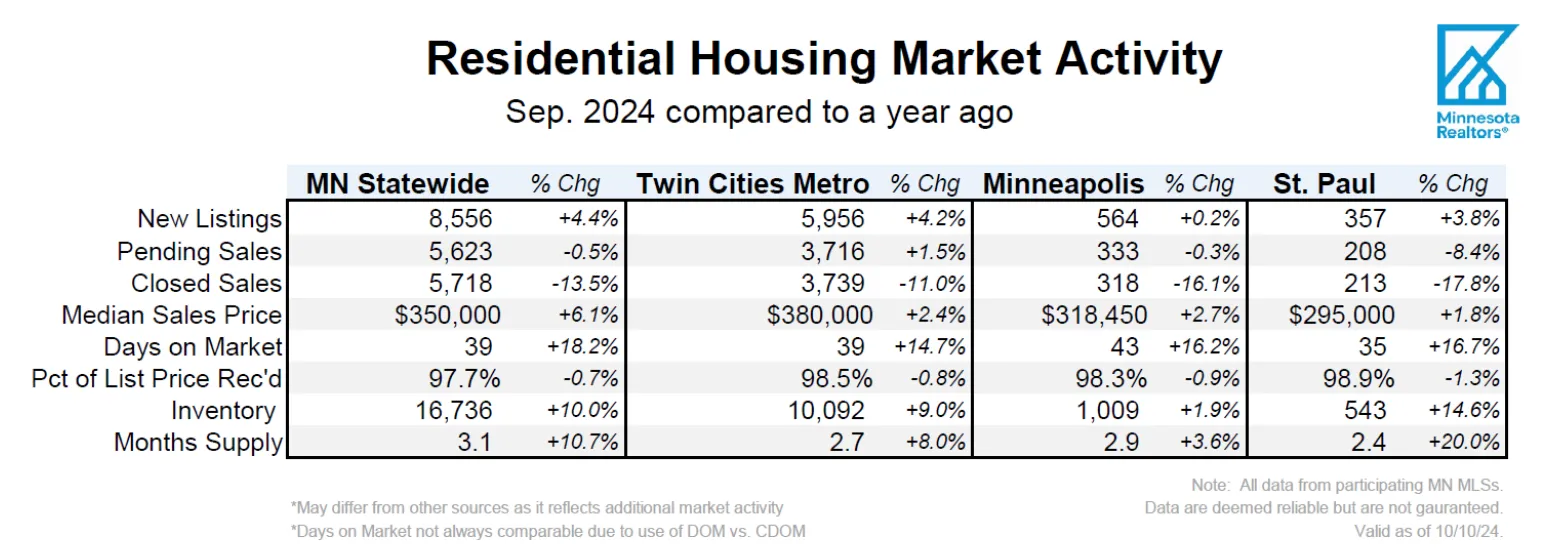
- Statewide, signed purchase agreements were down 0.5% and new listings were up 4.4%
- The median sales price increased 6.1% to $350,000
- Market times rose 18.2% to 39 days and inventory was up 10.0% to 16,736
(Oct. 15, 2024) – According to new data from the Minnesota state and Twin Cities metro REALTOR® Associations, listings rose compared to last year while sales were flat. Inventory and prices are both up.
Sellers, Buyers and Housing Supply
It’s no secret that buyers have been facing a triple punch lately: higher prices, higher mortgage rates and tight inventory. That’s shown up in slower sales activity, lower affordability and slim pickings when it comes to the number of homes for sale on the market. In fact, statewide, sales hit their lowest level since 2011, but now signed purchase agreements are rising. Sellers are caught in between—either they stay put in a home they might have outgrown or trade up to a higher price, higher mortgage rate and higher monthly payment. But there’s evidence that’s changing.
For example, the state and metro saw 4.4% and 4.2% more new listings, respectively, when compared to September 2023. For sales, statewide activity was relatively flat (down 0.5%) while metro-area activity rose a modest 1.5%. The fact that listing activity has been stronger than sales means inventory levels are up—most recently rising an even 10%. But we’re still in a sellers’ market. Lower inflation, stronger-than-expected hiring and the Federal Reserve’s mid-September rate cut are all reassuring signs for home buyers. That’s not to say there are no concerns about housing or the economy. For now, however, this marginally better confidence is helping to stabilize home sales and slightly improve affordability.
When it comes to mortgage rates, be careful what you wish for. Rates back below 5% could mean recession. The fact that so many homeowners enjoy rates below 4% creates the “lock-in effect” where would-be sellers choose to stay put instead of trading up to a higher price and higher rate. “There is still plenty of pent-up activity both buyers and sellers—who are being patient,” according to Geri Theis, President of Minnesota Realtors®. “That sounds like a good idea until you realize everyone else is waiting for the same thing. And as rates come down, some may find themselves in another competitive environment where listings are selling for over asking price,” she added.
Prices, Market Times and Negotiations
All situations and transactions are unique. First-time buyers without equity have an uphill battle while move-up buyers with equity from their first home are able to roll that into the next property. The more affordable price points have seen the largest declines in demand as those buyers are more rate sensitive. Luxury market activity continues to outperform as those buyers are less rate sensitive. Sales at or above $1M have risen 16.8% over the last 12 months, more than any other price point. Those relocating here with equity from higher-priced coastal markets should face fewer headwinds. And each market segment is unique as well. Some listings are still getting multiple offers and selling for over list price. Overall, however, sellers accepted offers at 97.7% of list price statewide and 98.5% in the metro. Both figures were down from last year. And those offers came in after an average of 39 days on market both statewide and in the metro—both figures up from a year ago. “There are significant differences from price point to price point and area to area,” said Jamar Hardy, President of Minneapolis Area REALTORS®. “Buyers were excited as rates hit the low sixes even though they’ve trickled higher since, and I believe we’ll see a real boost if and when we go below 6%.”
The state’s median home price was up 6.1% to $350,000; the metro median price was up 2.4% to $380,000. Since 2021, the typical mortgage payment on the median-priced Twin Cities home has risen from around $1,750 to $2,750 per month. Most economists agree that the path for rates should be lower, but it will be bumpy on the way down. What’s also true is that incomes are and have been rising faster than home prices. That should give households a chance for earnings to catch up to home prices. In the meantime, more supply will mean less competition and more choices, which should translate into better affordability and more manageable price growth. “I have buyers who are pleased to see more options to choose from,” said Amy Peterson, President of the Saint Paul Area Association of REALTORS®. “But for the most part sellers still hold the reigns even with the extra inventory we’ve seen.”
Location Differences | Minnesota Statewide
Market activity always varies by area, price point and property type. Regions such as Hibbing/Virginia and Bemidji saw the largest gains in new listings. Bemidji also saw the largest gain in pending sales and now has 6.2 months of supply—the most of any region. St. Cloud and Grand Rapids also had notable increases in sales. Homes sold the fastest in the Duluth/North Shore region along with St. Cloud and the core Twin Cities. Prices were highest in the metro followed by Detroit Lakes, Alexandria and Brainerd. The most affordable regions of the state are Hibbing/Virginia, Bemidji and Willmar.
Location Differences | Twin Cities Metro
For cities with at least five sales, Deephaven, Maple Plain and Mayer had the largest sales gains. The highest priced areas were Deephaven, Wayzata, Orono and Medina while the most affordable areas were Hutchinson, Norwood Young America and Robbinsdale. But the areas with the largest increases in sales price were Deephaven, Orono and Little Canada. The most oversupplied markets were Centerville, Hanover and Wayzata while the most undersupplied markets were Circle Pines, Crystal and New Hope. Homes took the longest to sell in Bayport, Annandale and Orono and sold the fastest in Corcoran, Arden Hills and Circle Pines.
From The Skinny Blog.
New Listings and Pending Sales
Inventory
- « Previous Page
- 1
- …
- 5
- 6
- 7
- 8
- 9
- …
- 87
- Next Page »