August 3, 2023
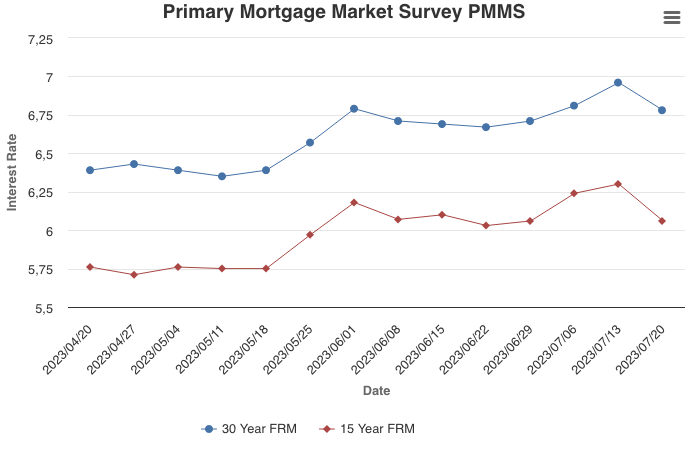
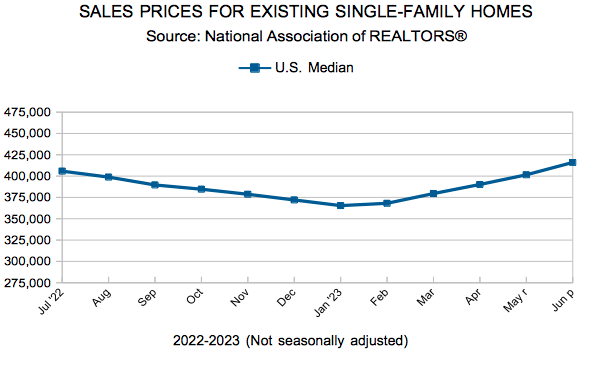
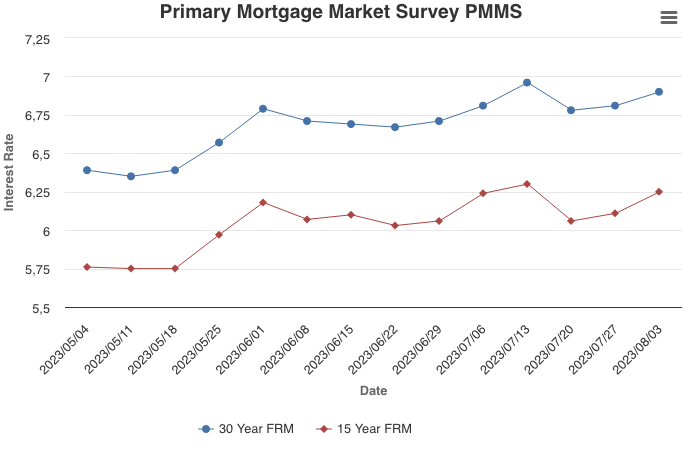
The combination of upbeat economic data and the U.S. government credit rating downgrade caused mortgage rates to rise this week. Despite higher rates and lower purchase demand, home prices have increased due to very low unsold inventory.
Information provided by Freddie Mac.
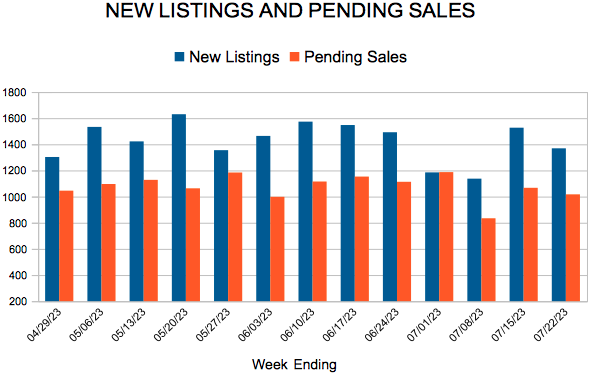
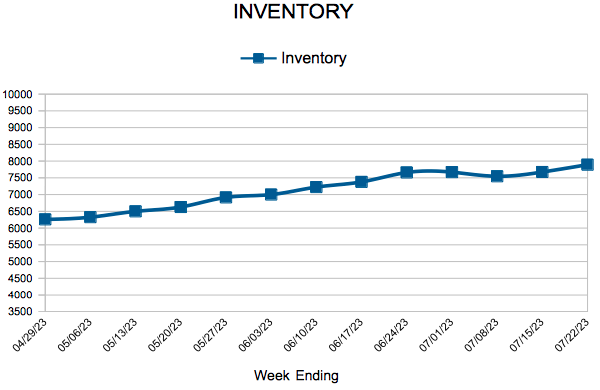
 For Week Ending July 22, 2023